

Proposal
The dataset for this project is a sample representing user sessions over a one year period in a city located in the United States from Airbnb. Data from this set informs Airbnb on how their customers interact with their service, how long they spend on looking for a room, and if they interact with certain features of the service, such as sending a message. This information can be used by Airbnb to determine how customers are accessing the site, how long they are spending on it, and if there are any problems. Consequently, improvements to their service model can be made, features that are not used on the website can be eliminated, and their web development team can stop supporting certain platforms if they are not used. For example, if Internet Explorer is not used very often, they can reduce support for that service and redirect resources to support the rise in mobile access.
Data
The spreadsheet for this project consists of data collected by Airbnb from a city in the United States over a one year period from users on their website. It was found on the Databits website as part of a challenge posted by Airbnb on user pathways
(http://databits.io/challenges/airbnb–user–pathways–challenge). The dataset contains over seven thousand records that would yield meaningful analysis once the set is analyzed.
Data Description
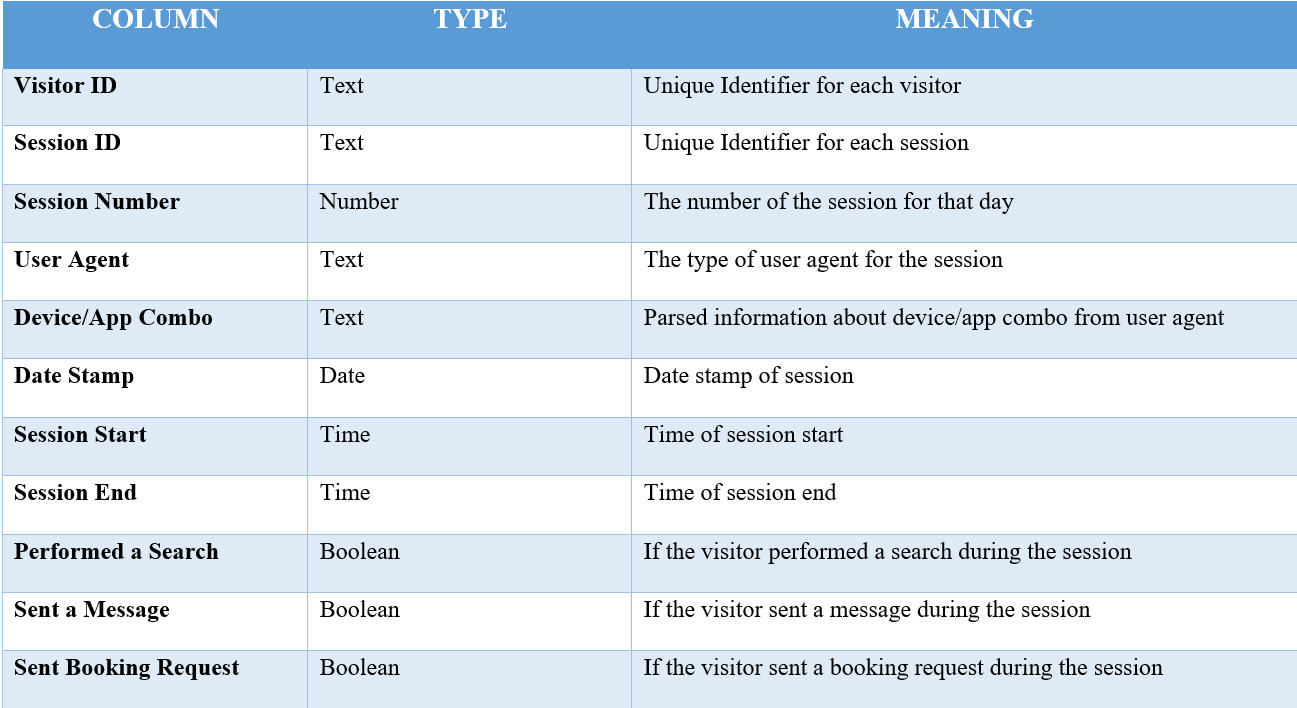
Sample Rows
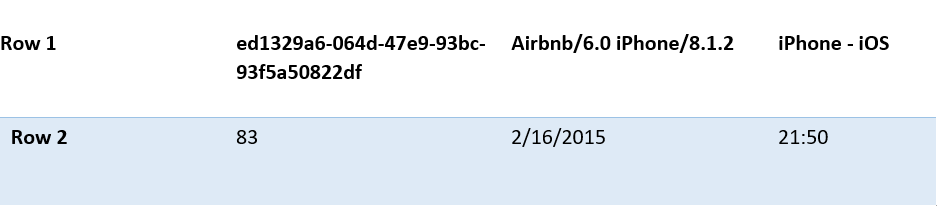
Row #1 shows the unique identifier for a visitor to the Airbnb website. The second column shows the user agent for the session, i.e. a trace of how the website was accessed by the customer. The final column shows the parsed information from the user agent column, i.e. the customer connected to the website via the iPhone, so the connection was done on a mobile device.
Row #2 shows the session number for each visitor for that day. The second column shows the date stamp for when the customer accessed the time, and the third column shows the start time of the interaction on the website.
Limitations
While the dataset from Airbnb contains over seven thousand records there is no location to tie the records to. It would have been useful to have a couple of datasets that included georeferencing or city codes in order to do a comparison of how the performance of the service differs from place to place. In addition, the data is from a one year period. Data from a couple of years would give a good idea of changes that have been made to the Airbnb business model or customer segments and the changes in how they access the service.
Exploration and Prediction Questions
- What is the average session duration for a customer on the website?
This question will help answer how long customers spend and need to make a booking on the Airbnb website. Is this effective? Are there problems in the process and can they be fixed to help customers to their goal?
- Is there a relation to how long a person spends on the site and making a booking?
Time spent looking for a booking and does it lead to a booking are the main questions that we are investigating with this question. Are people taking their time and doing research or are they just picking the first thing that they see? The results of this question will give us an idea of if people are planning ahead or taking last minute trips.
- Does the time a person spend on the site increase or decrease from their first visit?
After a customer has visited the website, does it take them a longer or shorter time to navigate the different features of the website? This information can be useful to determine if there are too many features and clutter on pages and could discourage or frustrate customers visiting the site and improvements can be made.
- What is the most used platform by customers when accessing the website?
Determining how customers are accessing the site can help determine where resources should be allotted for improvement and innovation. If customers are primarily accessing the website from mobile devices then it should be a seamless experience and they can get everything they need without having to rely on the full access from a desktop or laptop device.
- What is the relation between making a booking and sending a message?
This question investigates if patrons are making inquiries on available rooms before they make a booking. This helps in understanding what features patrons require and are using on the website.
Analysis
The analysis from these questions can be used by Airbnb to create a map of user behavior on their website. The type of devices that are used, what kind of actions are performed, and the outcomes of those interactions all help Airbnb determine the best way to orient their services to their customers. Where improvements can be made, how they can assign resources, and get customers to book with them are important considerations for Airbnb to fulfil their value proposition.
Watson Analytics Prediction
Our use of Watson Analytics will help in determining what is the most popular time of day for users to make a booking and on what device are customers using to make those bookings? The target for this will be time, therefore, the columns used will be device/app combo, session start, session end, and date stamp. This prediction will be useful to help Airbnb determine what times of the day are most popular for people to make bookings and through what device they are using.